Chapter 04Axis
D3 provide a library that makes drawing axes and the tick marks easy. To do so you generate a axis function by passing a scale to one fo the following methods. Then later, you call the function to draw the axis.
-
d3.axisTop(scale) - draw horizontal axis with ticks on top of line
-
d3.axisBottom(scale) - draw horizontal axis with ticks on bottom of line
-
d3.axisLeft(scale) - draw vertical axis with ticks on left of line
-
d3.axisRight(scale) - draw vertical axis with ticks on right of line
Below we show how to create an x-axis in a 600px wide by 100px high svg element. To start, we’ve created a scaling function and pass the scaling function to one of the axis generators.
var xScale = d3.scaleLinear()
    .domain([0, 5])
    .range([25, 555]);

var xAxis = d3.axisBottom(xScale);
We then append a group element (“g”) to the svg element, translate (i.e. move) the g element 75 pixels down, and invoke the xAxis function by passing it to the call method.
var svg = d3.select("#axisDemo1");

svg.append("g")
    .attr("transform", "translate(0,60)")
    .call(xAxis);
Last, we create a title for the axis.
svg.append("text")
    .attr("transform", "translate(300,95)")
    .style("text-anchor", "middle")
    .attr("fill", "black")
    .text("Title");
<script>
  var xScale = d3.scaleLinear()
        .domain([0, 5])
        .range([25, 555]);

  var xAxis = d3.axisBottom(xScale);

  var svg = d3.select("#axisDemo1");

  svg.append("g")
      .attr("transform", "translate(0,60)")
      .call(xAxis);

  svg.append("text")
      .attr("transform", "translate(300,95)")
      .style("text-anchor", "middle")
      .attr("fill", "black")
      .text("Title");
</script>

<svg id="axisDemo1" width="580" height="100"></svg>
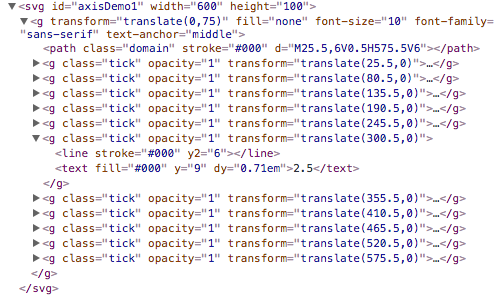
By inspecting the HTML, you can see that the axis consists of a path element for the horizontal line and a group of line and text elements for each tick. The horizontal line is made a member of the “domain” class and each tick is made a member of the “tick” class.
Tick Spacing
We can control various properties of the ticks like the line style, the number of ticks, and the location of ticks.
To suggest the number of ticks to display, we can call the ticks(count) method on the axis function object. Note that if we pass a single number to the ticks method, that number is only a suggestion. D3 will decide how many ticks to display and their spacing. For example, when I pass 4, 5, 6, or 7 to the ticks method shown below, 6 ticks are always drawn.
xAxis = d3.axisBottom(xScale)
   .ticks(6);
<script>
  xScale = d3.scaleLinear()
        .domain([0, 5])
        .range([25, 555]);


  xAxis = d3.axisBottom(xScale)
      .ticks(7);

  d3.select("#axisDemo2")
      .append("g")
      .attr("transform", "translate(0,75)")
      .call(xAxis);
</script>

<svg id="axisDemo2" width="580" height="100"></svg>
To display ticks at certain points we can use the tickValues method. For example, if I want to display ticks at 1, 3, and 4, I can do the following.
xAxis = d3.axisBottom(xScale)
    .tickValues([1,3,4]);
<script>
  xScale = d3.scaleLinear()
        .domain([0, 5])
        .range([25, 555]);

  xAxis = d3.axisBottom(xScale)
      .tickValues([1,3,4]);

  d3.select("#axisDemo3")
      .append("g")
      .attr("transform", "translate(0,75)")
      .call(xAxis);
</script>

<svg id="axisDemo3" width="580" height="100"></svg>
We can use various methods in D3’s array library to create an array which we can pass to tickValues. One such method is d3.range([start, ]stop[, step]) which returns an array containing an arithmetic progression. For example to generate ticks at the 1, 1.25, 1.5, and 1.75 we can use range to generate
var array = d3.range(1,2,0.25);

xAxis = d3.axisBottom(xScale)
      .tickValues(array)
      .tickFormat(d3.format(".2f"));
In the code shown above we use the tickFormat method to control how many digits are displayed under the tick. If we hadn’t called tickFormat, the tick labels would have been rounded to up to the nearest tenths place and displayed as 1, 1.3, 1.5 and 1.8. To control the format of the tick text we can set the tick format function which is called when the ticks are drawn by passing a tick format function to the axis’ tickFormat method. D3 provides both d3.format(specifier) and d3.timeFormat(specifier) to help create format functions.
<script>
  xScale = d3.scaleLinear()
        .domain([0, 5])
        .range([25, 555]);

  var array = d3.range(1,2,0.25);

  xAxis = d3.axisBottom(xScale)
      .tickValues(array)
      .tickFormat(d3.format(".2f"));

  d3.select("#axisDemo4")
      .append("g")
      .attr("transform", "translate(0,75)")
      .call(xAxis);
</script>

<svg id="axisDemo4" width="580" height="100"></svg>
Tick Length
We can control the length of each tick as well. Below we call tickSize and pass in a value that specifies the length of each tick. Notice that we passed an array containing the value -50. This values specifies the length of the inner ticks as well as the two outer ticks. By specifying a negative number we direct the axis generator to draw tick in the opposite direction that they would normally be drawn.
xAxis = d3.axisBottom(xScale)
    .tickValues([1,3,4])
    .tickSize([-50])
    .tickFormat(d3.format(".0f"));
<script>
  xScale = d3.scaleLinear()
        .domain([0, 5])
        .range([25, 555]);

  xAxis = d3.axisBottom(xScale)
      .tickValues([1,3,4])
      .tickSize([-50])
      .tickFormat(d3.format(".0f"));

  d3.select("#axisDemo5")
      .append("g")
      .attr("transform", "translate(0,75)")
      .call(xAxis);
</script>

<svg id="axisDemo5" width="580" height="100"></svg>
Alternatively, we can set just the length of the inner ticks by calling tickSizeInner or set the length of the outer ticks by calling tickSizeOuter.
xAxis = d3.axisBottom(xScale)
    .tickValues([1,3,4])
    .tickSizeInner([-50])
    .tickFormat(d3.format(".0f"));
<script>
  xScale = d3.scaleLinear()
        .domain([0, 5])
        .range([25, 555]);

  xAxis = d3.axisBottom(xScale)
      .tickValues([1,3,4])
      .tickSizeInner([-50])
      .tickFormat(d3.format(".0f"));

  d3.select("#axisDemo6")
      .append("g")
      .attr("transform", "translate(0,75)")
      .call(xAxis);
</script>

<svg id="axisDemo6" width="580" height="100"></svg>
We can also control the space between axis and the tick labels by calling tickPadding.
xAxis = d3.axisBottom(xScale)
    .tickValues([1,3,4])
    .tickPadding([10])
    .tickFormat(d3.format(".0f"));
<script>
  xScale = d3.scaleLinear()
        .domain([0, 5])
        .range([25, 555]);

  xAxis = d3.axisBottom(xScale)
      .tickValues([1,3,4])
      .tickPadding([10])
      .tickFormat(d3.format(".0f"));

  d3.select("#axisDemo7")
      .append("g")
      .attr("transform", "translate(0,75)")
      .call(xAxis);
</script>

<svg id="axisDemo7" width="580" height="100"></svg>
Tick Line Style
We can also change the style of the line that is drawn for each tick. Below we draw each of the inner ticks as a dotted line.
To do so, we create the set of ticks, each of length 50, as we did before. After the ticks have been added to the DOM, we select all of the line elements in the tick groups and set their stroke-dasharray attributes.
>d3.select("#axisDemo8")
    .selectAll(".tick line")
    .attr("stroke-dasharray", "2,2");
<script>
  xScale = d3.scaleLinear()
        .domain([0, 5])
        .range([25, 555]);

  xAxis = d3.axisBottom(xScale)
      .tickValues([1,3,4])
      .tickSizeInner([-50])
      .tickFormat(d3.format(".0f"));

  d3.select("#axisDemo8")
      .append("g")
      .attr("transform", "translate(0,75)")
      .call(xAxis);

  d3.select("#axisDemo8")
      .selectAll(".tick line")
      .attr("stroke-dasharray", "2,2");
</script>

<svg id="axisDemo8" width="580" height="100"></svg>